Steps to identify the SQL Server instance utilizing most of the CPU
Step 1:- First launch Windows Task Manager to find out the CPU utilization for your database server. Below is screenshot of the Task Manager at the time of the issue I experienced. You can see all three instances have the same executable i.e. 'sqlservr.exe' and also you can see 76% of the CPU is being utilized by the first sqlservr.exe process.
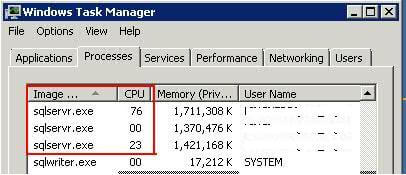
Based on reviewing Windows Task Manager, one immediate option to determine which SQL Server instance is using all of the CPU is to run each SQL Server instances with a different domain account. For example, "Domain\SQLDev" for the development environment, "Domain\SQLTest" for the test environment, etc. Unfortunately, in my circumstance all of the SQL Server instances were running under same domain account. In the image above the accounts have been erased, but they would be found in the fourth column i.e. "User Name".
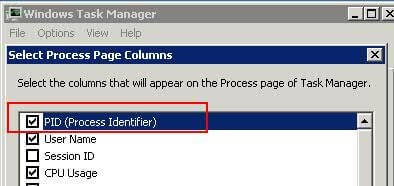
Step 2:- Now we will add the PID (Process Identifier) column in Windows Task Manager to in order to find out the PID for each process. The PID is the Windows Operating System Process Identifier assigned to each process running on the machine. In order to enable this column, ensure the "Processes" tab is active then click on the "View" menu, then choose the "Select Columns..." option. Once on the "Select Process Page Columns" screen click the check box for the option PID and then press the "OK" button to return to the Processes tab of Windows Task Manager.
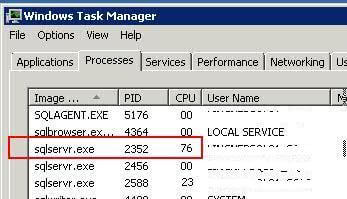
Step 3:- Now you can see the PID for the 'sqlservr.exe' process which is utilizing most of the CPU. In our example, the PID of this SQL Server instance is 2352.
Now our next step is to determine which SQL Server instance is running this PID. We have two methods to get this information. First, is the SQL Server configuration manager and second method is the SQL Server error log.
From SQL Server 2005 onwards, it is very easy to find the PID for the SQL Server instances using the SQL Server Configuration manager. However, with SQL Server 2000 and earlier, it is not as straight forward. We will proceed with the assumption that community members are using SQL Server 2005 and beyond.
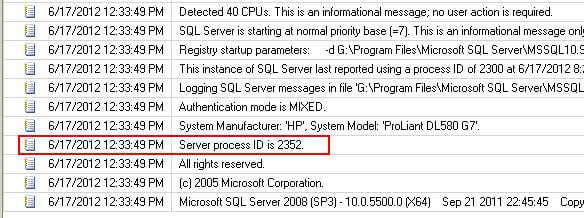
Step 4:- Whenever we start a SQL Server instance, a PID which is also know as the "Server process ID" is assigned to that instance and this information is logged in the SQL Server error log. You can see an example of this in the screenshot below. The "Server process ID" is normally one of the first entries in the log.
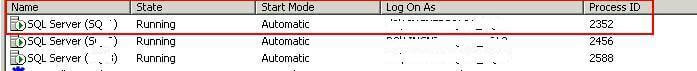
Step 5:-Another option is identify the correct PID for your SQL Server Instance is by using the SQL Server configuration manager. This can be accomplished by launching the SQL Server Configuration Manager and clicking on the "SQL Server Services" option in the left pane. On right side of this interface, you can see the Process ID values associated with the SQL Server services.
By correlating the information from Windows Task Manager and the SQL Server Error Log\SQL Server Configuration Manager you can correctly determine the SQL Server instance which is utilizing most of the CPU. At this point you can review the SQL Server processes on the aforementioned instance to determine the culprit process(es) which are causing CPU pressure.
-- Shivasagar V
